Liquor Store Profit Margins
Profit Leaks and Protection
Your gross margin looks fine on paper. Somewhere between 22 and 28 percent, depending on your mix. The math says you should be profitable. But month after month, the bank account comes in tighter than the numbers suggest, with less room to maneuver than it should be.
It’s not a math error. It’s a structural problem that catches even well-run stores off guard, and almost every article written about liquor store profit margins makes it harder to diagnose. They cite gross margin figures, list strategies like “negotiate with vendors” and “train your staff,” and leave with the impression that a 25% gross margin means 25 cents of every dollar ends up in your pocket.
It doesn’t. Not even close.
Margins in this business are not one number. They’re a stack of layers, and it’s entirely possible to be doing most things right and still lose ground at two or three of them simultaneously. This article works through those layers with specific numbers, identifies four places margin most commonly leaks, and gives you a self-audit you can run this week.
What “A 25% Margin” Actually Means for Your Store
The Five Costs That Eat the Difference Between Gross and Net
Gross margin tells you what you kept after paying your distributor for the product. It does not tell you what you kept after running your business.
Here is what comes out of that 25% before you see a dollar of profit:
Labor typically runs 8–12% of revenue for an independent store with full-time staff. That’s your cashiers, your receiving staff, yourself — all of it. If you’re open seven days a week, labor is your biggest operating line item by a wide margin.
Occupancy (rent, utilities, maintenance) runs another 5–8% depending on your market and whether you own or lease. A well-located store in a competitive urban market may be closer to 10%.
Shrinkage like theft, breakage, receiving errors, and administrative mistakes costs the average retailer 2–4% of annual revenue. Most operators significantly underestimate this number because a lot of it is invisible. More on this below.
Credit card processing fees run 2.5–3.5% of revenue for most independent stores. That is a significant line item on its own, but the real problem is that many operators do not know what they are actually paying. Processor statements are dense and deliberately hard to read. Hidden markups, vague fee names, and unbundled charges are common, particularly for smaller operators who do not have the volume leverage to demand transparency. A store doing $1M in annual revenue could easily be paying $30,000 or more in processing fees, and a meaningful portion of that may be markup that is negotiable or avoidable. When evaluating your processing costs, look for a processor that will match or beat your current rate and provide transparent fee reporting with no hidden charges. That topic deserves its own deep dive, but for now, know that your processing costs belong in this calculation and are worth auditing.
Licensing, insurance, and compliance costs add another 1–2%, depending on your state.
Add those up conservatively and you’re looking at 19–26% of revenue before you reach net income. On a 25% gross margin, the math gets very tight very quickly. The industry benchmark for a well-run independent store is 10–15% net, which tells you that stores hitting the upper end of that range are managing every one of these cost lines carefully, not just the obvious ones.
What Best-in-Class Actually Looks Like
The stores consistently hitting 13–15% net share a few operational traits: they track margin at the category and SKU level (not just blended), they catch invoice price changes quickly, and they make product mix decisions with data rather than rep relationships. Those are not personality traits. They are workflows. Which means they are learnable and replicable.
The Four Places Your Margins Are Leaking Right Now
Leakage #1: Invoice Price Drift
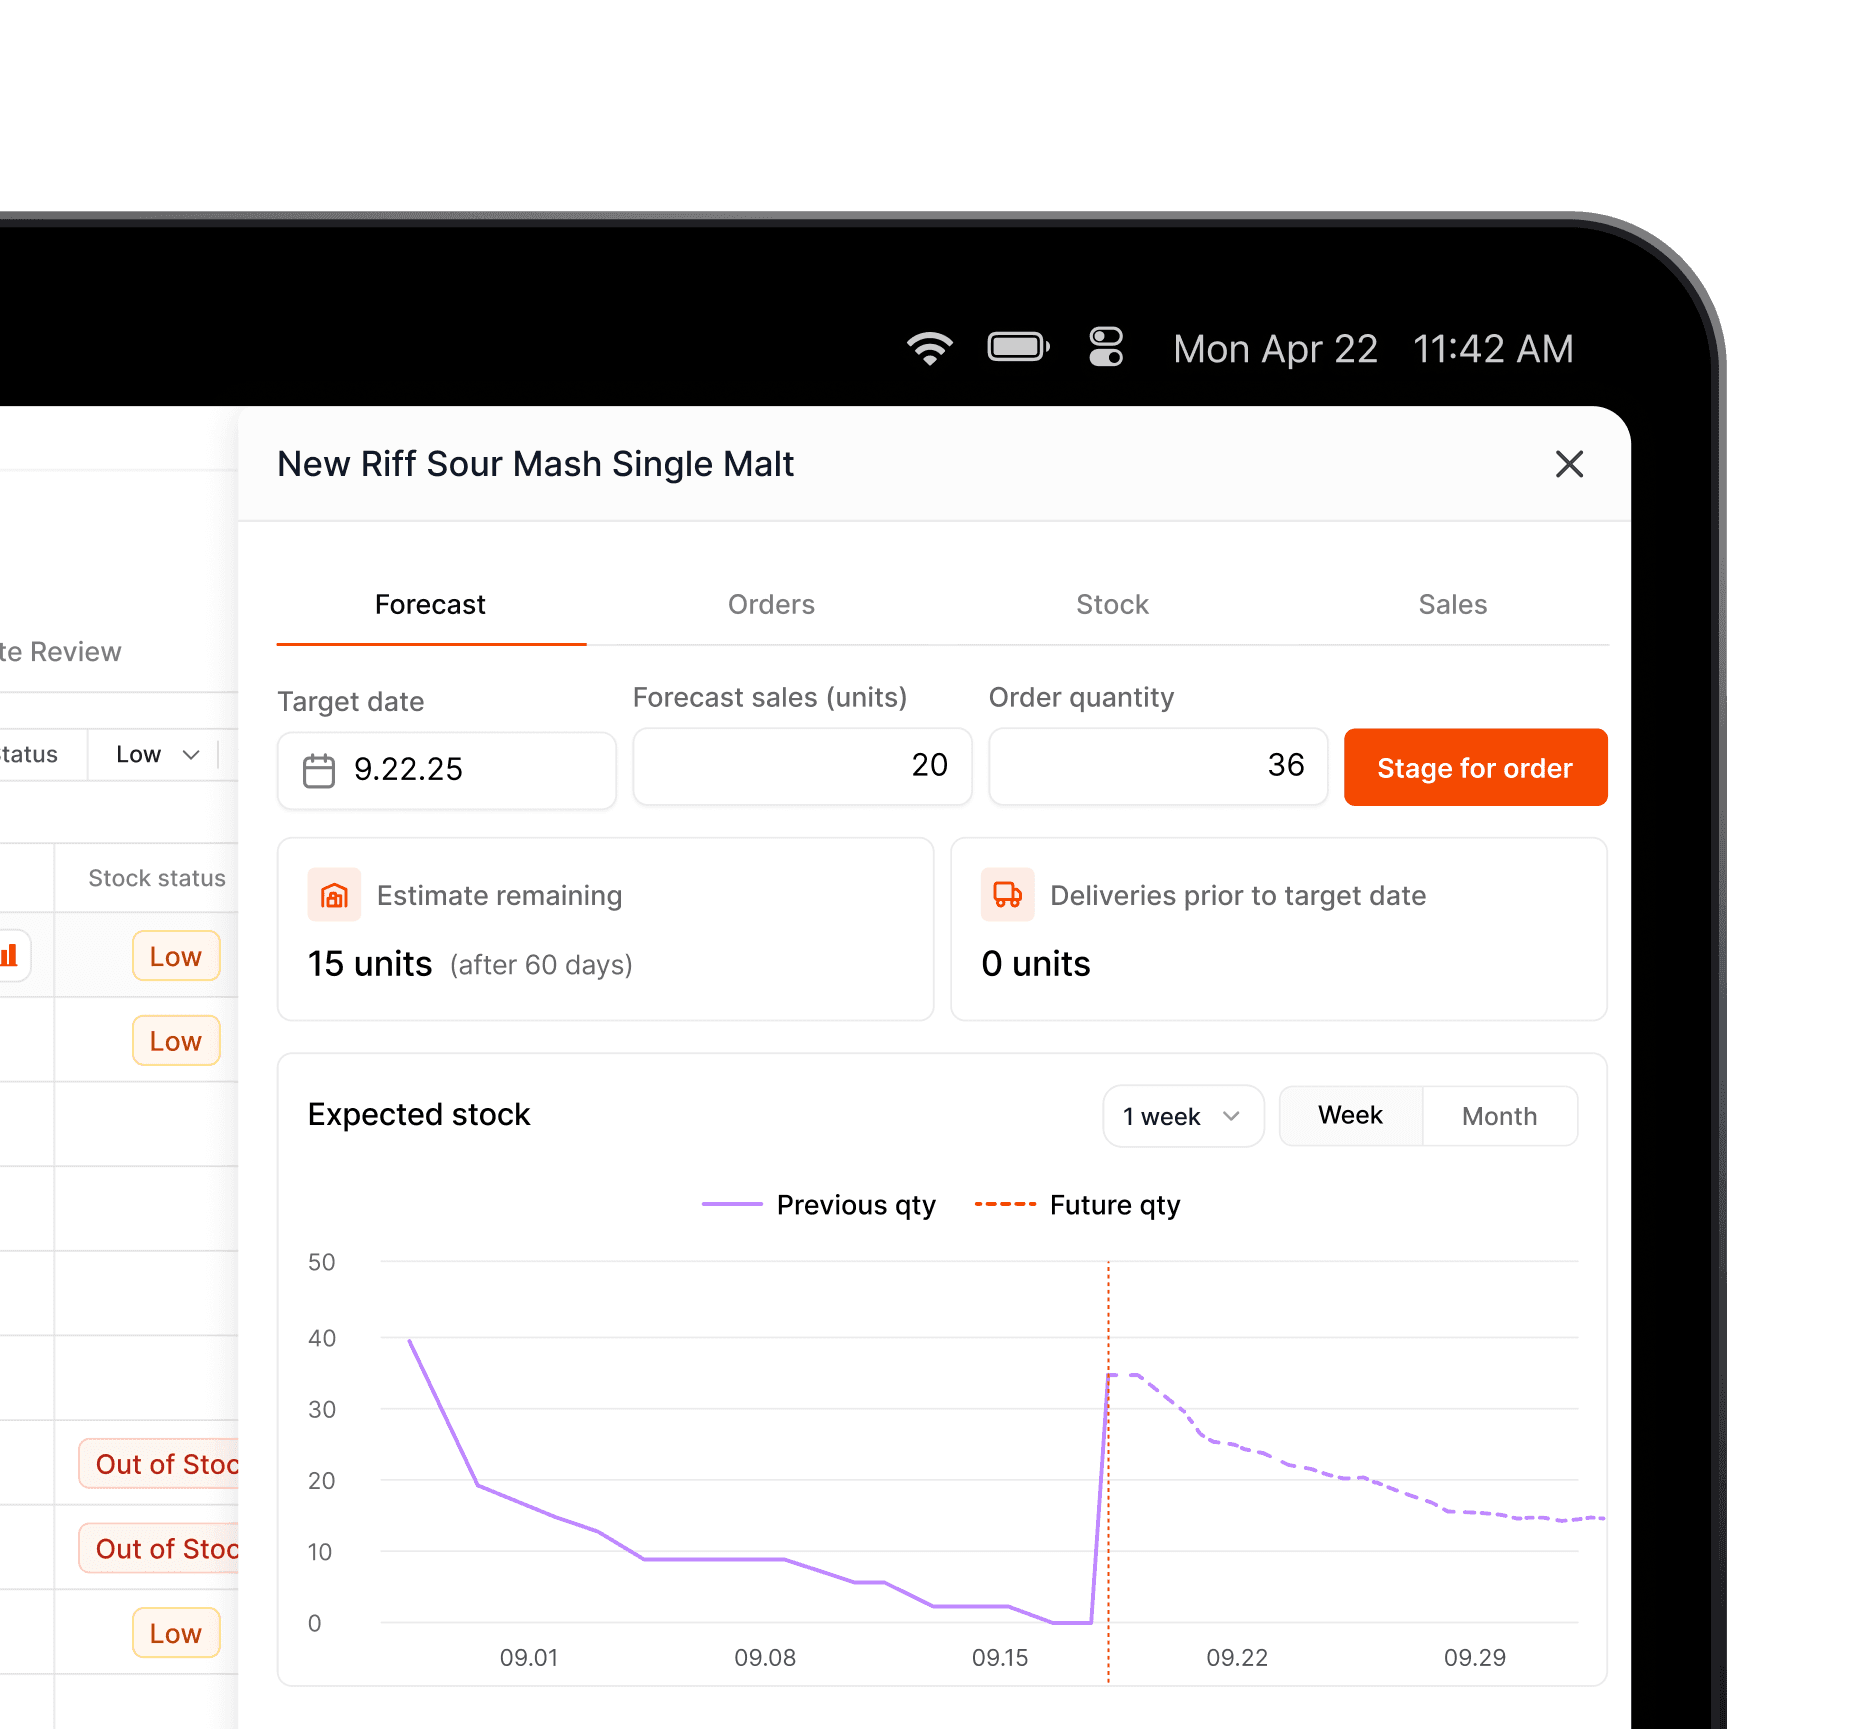
Your distributor raises the price on a case of rye whiskey by $4. The invoice comes in, gets entered into your system, and your cost updates. But your shelf price does not, because nobody flagged it, and the pricing update got lost in the operational noise of a busy receiving day.
For the next three weeks, you sell that whiskey at the old shelf price. You think you’re making 38%. You’re actually making 31%. By the time you catch it, usually at month-end when the margin report looks wrong, you’ve already sold 40 cases.
This is invoice price drift. It happens constantly in liquor retail because distributor prices change frequently and the gap between “cost updated” and “shelf price updated” is filled by manual steps that are easy to skip.
The operational fix is to connect invoice receiving to a target margin calculation. Every time a new invoice comes in, your system should flag any product where the new cost would push your margin below target, before the product hits the shelf, not three weeks later. With OCR invoice processing, invoices are parsed automatically when you photograph or upload them, costs update immediately, and price-to-margin alerts fire the moment a discrepancy is detected. No manual cross-checking. No end-of-month surprises.
Most stores running older systems catch this problem in their accounting software weeks after it happened, if they catch it at all. The fix requires it to surface at the moment of receiving, not after the fact.
Leakage #2: Product Mix Imbalance
The average independent liquor store allocates 40–50% of its floor space and buying budget to beer. Beer typically yields 15–25% gross margin. Spirits run 35–55%. Wine runs 30–50%.
That is not a small difference. It is a structural drag on your blended margin that most operators do not see clearly because they have never pulled a category-level margin report.
Here is a simple scenario. You currently make $1M in revenue with a 24% blended gross margin. Beer accounts for 45% of that revenue at an 18% margin. If you shifted 10% of your buying budget from domestic beer to premium spirits, adding $100K in spirits revenue at a 42% margin and reducing beer by $100K at 18%, your blended margin moves to approximately 26.4%. On $1M in revenue, that is $24,000 in additional gross profit annually.
That is not a rounding error. That is a part-time employee’s salary recovered by changing what you stock, not how hard you work.
The counterargument is always foot traffic. Beer drives visits. That is a real consideration. But many independent stores have overcorrected, carrying a full domestic beer set that runs at beer margins when the same cooler space, used differently, would generate meaningfully more profit per square foot.
RTDs (ready-to-drink cocktails, primarily spirit-based) are worth watching as a complement here. Spirit-based RTDs grew 20% in revenue in 2025 despite broad category declines in beer, wine, and spirits. They carry better margins than domestic beer, they have genuine consumer pull, and they do not require the same floor space commitment as a full beer cooler.
The problem is that most operators are making these mix decisions without the data to back them up. A category-level margin report that shows you what each section of your store is actually earning per square foot changes the conversation from gut instinct to informed decision.
Leakage #3: Dead Stock and Holding Costs
A bottle sitting on your shelf for six months is not breaking even. It is losing money.
Carrying costs for slow-moving inventory run 18–25% of inventory value annually when you account for tied-up capital, storage space, and the opportunity cost of that shelf position. A case of wine sitting unsold for a year at $120 cost has cost you $21–30 in holding costs on top of the product cost itself. If you eventually sell it at a price that yields a 35% gross margin, the real margin, accounting for carry, is closer to 20%.
Most stores have more dead stock than they realize. It tends to accumulate in the same places: high-priced allocated spirits that were exciting to order but have a tiny local customer base, seasonal items that never moved last year and got reordered out of habit, and obscure wine labels that a rep convinced you to try.
The fix is inventory turnover tracking by category. The benchmark for a well-run independent store is 6–8 inventory turns annually on overall stock. High-velocity domestic beer should turn much faster, closer to 12–15x. Premium allocated spirits may turn slower, and that is acceptable if the margin justifies it. The problem is when slow-turning products have low margins too. Those are the ones actively destroying profitability.
The data question is: which specific products are aging on your shelves, and what is the holding cost you’ve already absorbed? Stores with purpose-built inventory analytics can rank products by sell-through rate and flag aging stock automatically. Stores without that visibility are usually finding the dead stock at cycle count time, months after it became a problem.
Pull your current inventory report and sort by “last sold” date. Any product that has not sold in 90 days deserves immediate attention: a price reduction to clear it, a return if your distributor allows it, or a decision not to reorder. For more on optimizing your inventory strategy, see our guide to liquor store inventory management software.
Leakage #4: Shrinkage
Retail shrinkage costs US retailers an estimated $112 billion annually. For liquor stores specifically, industry data puts the shrinkage rate at 2–4% of revenue, combining employee theft, customer theft, breakage, receiving errors, and administrative mistakes.
Run that number against your own store. If you’re doing $1M in annual revenue and your shrinkage rate is 3%, that is $30,000 per year. If your net margin is 12% ($120,000 on $1M), shrinkage at that level is eating 25% of your total net income.
The stores that consistently run shrinkage rates below 1% are not luckier than you. They have systems that catch discrepancies in near-real time instead of at quarterly inventory counts. The difference between catching a theft pattern in week one versus month three can be the difference between a minor loss and a significant one.
Real-time inventory discrepancy tracking compares what your system expects to be on the shelf against what is actually there, flagging variances by SKU and time period as they develop. That is how you catch the problem when it is still small, not after it has compounded into a material number on your annual P&L.
How to Track Margin at the Level That Actually Matters
Margin-on-Paper vs. Margin-in-Practice
Your accounting system gives you a blended gross margin. That number is useful for your tax return. It is not useful for making decisions about what to stock, what to price, or where your profitability problems actually are.
Margin-in-practice means tracking at three levels: SKU, category, and blended. Category-level reporting tells you whether beer or spirits is dragging your average down. SKU-level reporting tells you which specific products are the offenders. Blended margin tells you where you landed.
Most POS systems, especially the ones built in the 1990s that still power a large share of independent stores, can export raw sales data. What they cannot do is surface the right insights automatically. When the question is “profit is down, what should I do?” those older systems have no answer. You are building a new spreadsheet every time you want to understand why.
Purpose-built analytics, like the embedded Sigma BI dashboards in Scotch, let you slice margin data by category, SKU, time period, and location without rebuilding your analysis from scratch each month. You see your margin story as it develops, not after it has already developed. More important, the system flags where the problem is, so you are not spending two hours reconstructing what your own business did last quarter.
Setting a Target Margin at the Point of Receiving
Most stores price products once, when a new SKU is added, and revisit pricing only when a customer complains or a rep suggests it. This is reactive pricing, and it is why invoice price drift is so common.
Best practice is to set a target margin per product category and let your system calculate the required retail price automatically every time a new invoice is received. If your target on premium spirits is 42% and a new invoice raises the cost on a bottle by $2.50, your system should immediately show you the new required shelf price to maintain that margin. You confirm, update the label, and move on. The whole process takes 30 seconds instead of getting missed entirely.
This is what target margin pricing looks like in practice. It shifts pricing from a periodic task that gets skipped to an automatic part of your receiving workflow.
FIFO Costing: Why It Matters for Cost Accuracy
FIFO (first in, first out) means your cost of goods sold reflects the cost of your oldest inventory layer. In a rising-price environment, which liquor retail has been in for several years, FIFO means your reported COGS is based on older, lower-cost units while your newer, higher-cost inventory is sitting in stock.
This matters because it can make your margins look better than they actually are on a forward-looking basis. When that newer, higher-cost layer becomes your selling inventory, your realized margins compress. Stores that do not track cost layers carefully often discover this compression too late.
Accurate FIFO tracking keeps your cost basis current as invoice prices change, so your reported margin reflects what you’re actually earning on the units you’re actually selling, not an artifact of your oldest cost layer.
Product Mix: Where Independent Stores Leave the Most Margin on the Table
Beer vs. Wine vs. Spirits: The Real Numbers
| Category | Typical Gross Margin Range |
|---|---|
| Domestic beer | 15–20% |
| Craft beer | 25–40% |
| Table wine | 30–40% |
| Premium / fine wine | 45–55% |
| Well spirits | 35–45% |
| Premium / top-shelf spirits | 45–65% |
| Spirit-based RTDs | 30–45% |
These ranges come from industry sources and will vary based on your market, your state’s pricing regulations, and your distributor relationships. The key insight is not the specific numbers. It is the spread. The gap between domestic beer margins and premium spirits margins is 30–45 points.
How to Rebalance Without Alienating Your Beer Customers
You do not need to gut your beer cooler. You need to understand what your current mix is costing you and make small, data-informed shifts.
Start by pulling a category-level margin report for the last 90 days. Calculate what percentage of your floor space each category occupies versus what percentage of your gross profit each category generates. If beer is taking 45% of your floor space but generating 25% of your gross profit, that gap is your opportunity.
Shift incrementally. Add a craft beer set in place of some domestic SKUs (better margins, same cooler footprint). Expand your spirits section by 10% at the cost of slower-moving beer varieties. Add a premium wine display near the register instead of a beer impulse display.
Track the blended margin impact after 60 days. If it moves in the right direction, which it almost certainly will, you have your data to continue.
Practical Benchmarks to Measure Yourself Against
Gross Margin by Category
Use the table above as a starting point. If your domestic beer margin is below 15%, you may be leaving money on the table with your pricing. If your premium spirits margin is below 35%, check your cost tracking. Invoice price drift is a common culprit.
Inventory Turnover
Target 6–8 inventory turns annually for overall stock. High-velocity domestic beer should be closer to 12–15x. Premium spirits can reasonably be 3–5x if the margin justifies the slower turn. The number to watch is turns-per-category. Your blended turnover can look acceptable while individual categories hide significant dead stock problems.
Net Margin
A well-run independent liquor store should net 10–15% after all operating expenses. If you are consistently below 8%, you have a structural issue, not just a tactical one, and the four leakage points above are the right place to start diagnosing it.
If you are in a volume decline environment (total beverage alcohol was down 3% in the first half of 2025, with beer down roughly 6%, spirits down 6%, and wine down 8.7%), protecting margin on every unit sold matters more than it did two years ago. The stores that coasted on volume growth are feeling that now.
A Note for Stores in Wholesale-Eligible States
If you operate in Kansas, South Carolina, or Texas, states that permit retail-to-bar and restaurant sales, your margin structure on B2B transactions operates differently than your retail floor. Wholesale pricing typically runs at lower margins than retail, but the volume per transaction and the reduced labor cost per dollar of revenue can make it worthwhile.
If you are pursuing wholesale sales in these states, track your B2B margin separately from your retail margin. Mixing them into a single blended number makes both harder to manage and obscures where your profitability actually comes from.
Run a Margin Audit on Your Store This Week
You do not need a consultant to get started. Here is a five-step audit you can run with whatever tools you have right now. If those tools are a legacy POS and a spreadsheet, this exercise will also show you exactly where your current system’s limits are.
Step 1: Pull gross margin by category. Export your sales data for the last 90 days and calculate gross margin by beer, wine, and spirits separately. If your POS cannot do this natively, a spreadsheet with category-tagged sales and cost data will work. Find the gap between your best-performing and worst-performing categories.
Step 2: Find your three largest dead stock positions. Sort your inventory by last-sale date. Identify the three products with the highest inventory value that have not sold in 60+ days. Calculate the holding cost at 20% annually. These are your immediate clearance candidates.
Step 3: Compare your last five invoices against current shelf prices. For your top 20 SKUs by revenue, check whether the cost on your most recent invoice is reflected in your current shelf price and margin. If you find more than two mismatches, invoice price drift is an active problem for you. If this check took more than an hour, that is also useful information about your current workflows.
Step 4: Calculate your shrinkage rate. Take your most recent cycle count results, compare them to what your system expected, and calculate the variance as a percentage of cost value. If you do not have recent cycle count data, that gap in process is the first thing to fix.
Step 5: Calculate your net margin from last month’s P&L. Gross profit minus total operating expenses, divided by revenue. If this number surprises you, work backward through steps 1–4 to find where the gap is coming from.
This audit will not tell you everything. But it will tell you which of the four leakage points is most acute for your store, and that is where to focus first. It will also tell you whether you can answer these questions quickly with your current system, or whether getting the answers requires hours of manual work you rarely have time for.
The stores that consistently outperform on net margin are not doing something magical. They track their numbers at the right level of detail, they catch cost changes before they become margin problems, and they make product mix decisions based on data rather than habit.
The gross-to-net gap is real, and it is bridgeable. You just need to know exactly where your money is going.
To see how Scotch’s margin tools and embedded BI dashboards let you track margin by SKU and category, set target margins at the point of receiving invoices, and surface the “profit is down, what should I do?” answer without building a new spreadsheet — book a demo. It is a 30-minute walkthrough built specifically for how independent liquor stores actually operate.